
How to Calculate the True Cost of Returns and Use Data to Reduce Them
Retailers care a lot about returns. They hurt their business, so it’s natural that they look for ways to stop the bleeding. Can we process these faster? Consolidate them cheaply? Route them more efficiently?
But it’s a little like giving a tylenol to someone with a gaping wound.
They get so focused on “how do we make this hurt less?” they forget to stitch up the actual problem in front of them.
Processing, consolidation and routing are about what happens after a return, not what caused it.
Antonio Colicchio spent two decades inside of and consulting omnichannel retailers. As the first VP of Returns, Fraud, and Abuse at a major global apparel retailer, he built the function from scratch and developed a methodology for tracing returns to their root causes.
He believes that most returns result from decisions retailers made, not from customer behavior retailers can’t control.
It’s Not About the Customer…?
From his position in customer care, Antonio heard directly from customers about why they returned products. What came through clearly to him was that a large share of returns had nothing to do with customer preference or fraud.
He’s not off the mark, the Total Retail Loss Benchmark Report from Appriss shows that only $100 billion of their studied $706 billion in returns comes from fraud and abuse.
Antonio’s POV: customers are remarkably specific about why they’re unhappy. They’ll tell you exactly what went wrong.
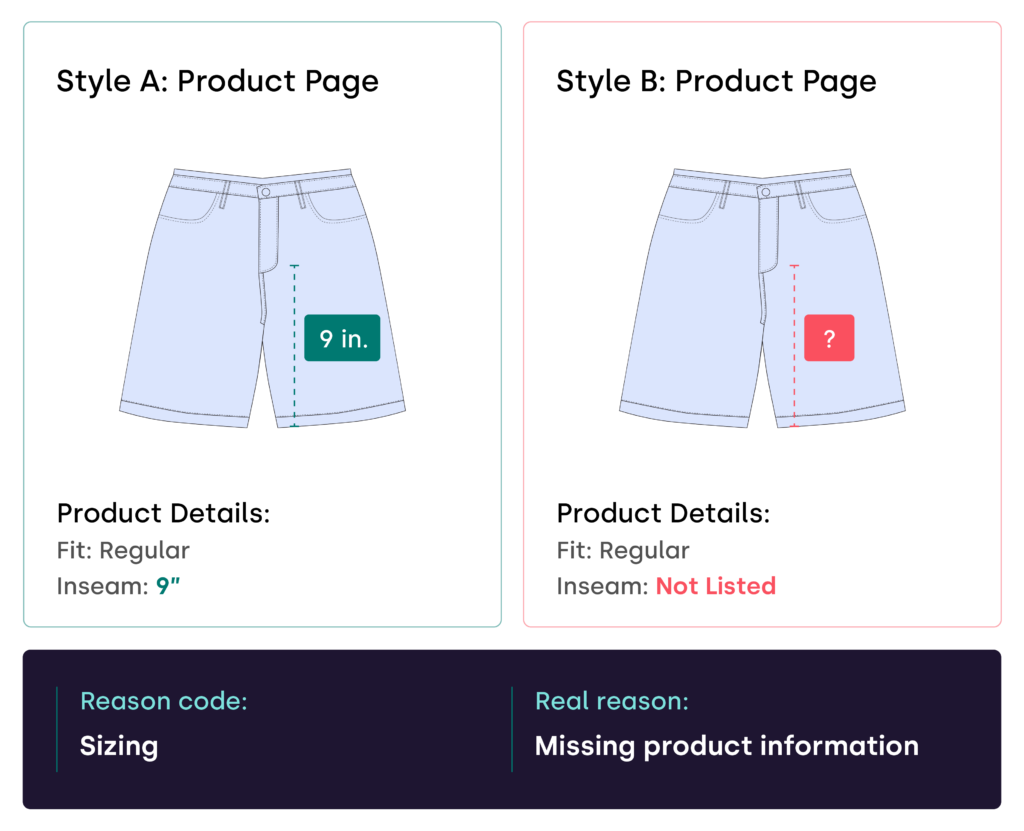
Often the problem is the reason code. They’re forced to pick from codes that don’t represent what they actually care about, or the real reason they made the return.
A customer returned a pair of shorts → the return was logged as a sizing issue → the real issue was a lack of info on the product page.
“Too big,” “too small,” “changed my mind”–these are all just symptoms, according to Antonio. The real cause is somewhere way upstream. Missing product information, policies that don’t talk to one another (we’ll get to it), and promotions that encourage impulse buys rather than well-researched decisions.
Every Return Is a Defect With a Traceable Cause
If a refrigerator company had a 30% return rate, they would investigate every dimension of design, production, and marketing until they found the problem. Apparel retailers accept that 30% rate as normal without applying the same rigor. Customers are buying with less consideration, less research and on repeat, so for these retailers it’s just the nature of the beast.
Antonio believes more retailers should adopt a manufacturing mindset
Every return has the same root signal: the customer didn’t get what they thought they were going to get. The reason code is secondary.
The real question is what the retailer did (or failed to do) that created that gap between ‘what I thought I was getting’ and ‘what I wanted’. Once you accept that framing, the problem becomes solvable. Fixes can be prioritized.
Four Steps To Find and Fix Controllable Returns
Tracking returns to their root causes requires looking across products, experiences, operations, and policies. Antonio takes four steps to go from customer complaint to calculated decision.
Listen to Customer Care Data To Find Gaps
Remember those returned shorts? That customer emailed the retailer with a very specific complaint: She’d bought shorts with the inseam listed on the product page, loved them, and went back to buy another pair. The inseam wasn’t listed on the second style. She assumed they’d be the same, bought them, and they didn’t fit.
Her question was simple: why wasn’t the inseam listed?
When that customer processed her return, she selected the closest available reason code: “too long.” Anyone reviewing that data would investigate fit and sizing. Nobody would investigate incomplete product information because the reason code pointed in the wrong direction. Antonio knows customer care is where specific, operational complaints surface.
“I don’t think there’s a better place to really learn about your business, your products, and your customers than in customer care. That’s the funnel where all the good stuff and all the bad stuff flows through.”
Run an Audit to Measure the Problem’s Range
After confirming the complaint, Antonio audited a sample of shorts styles on their site. From evaluating a sample set, he found inconsistencies on which products had the inseam listed and which did not. Different merchants managed those products. It was uncovered that different teams involved in setting up product pages had different processes.
This single customer complaint, once audited correctly, showed a glaring gap in the system–not the product itself. Antonio notes that small samples can work for this kind of auditing: if inconsistency exists across a dozen or so products, it almost certainly exists across hundreds.
The goal at this stage is determining whether a problem is isolated or structural.
Map Competing Policies
Antonio found that most retailers don’t sync their price adjustment policy with their return policy. A 30-day return window with a 7-day price adjustment window means a customer who misses the adjustment deadline has a simple workaround: buy the item at the sale price, return the original.
Customers approach promotions with this same laissez-faire attitude. When a customer adds an item to hit a free shipping threshold, they’re making a lower-confidence decision. They researched the item they came for. They didn’t research the add-on.
That add-on is more likely to come back.
When policies account for other policies (I see your return window and I raise you this price adjustment), you stop creating returns through your own incentive structures. The customer who re-bought at the sale price and returned the original did exactly what your policy allowed, even encouraged. Closing that gap recognizes editing the policy instead of changing customer behavior.
Calculate and Create Room for Targeted Incentives
Once you know the probable outcomes of a given return scenario, you can calculate the expected cost and decide whether an intervention is worth it. That math applies at two different moments in the customer journey, and the tactic changes depending on where you use it.
Before the purchase: If a retailer’s data shows that 75% of customers who bracket a medium and large shirt keep the medium, they can use that probability to act before they checkout. Calculate the probability-weighted cost of the likely return, then determine what incentive would cost less than that return. Offering the customer $10 off to commit to the medium now, rather than bracket, costs less than processing the return later. The forecasting does the work: you already know the probable outcome, so you price the intervention accordingly.
After the purchase: One children’s apparel brand applies a different version of this math once the customer is already in the return portal. When parents buy both the size 10 and size 12 for a child and initiate a return on the larger size, the brand offers a small discount to keep it instead. The logic is straightforward: the size 12 will fit in a year. No forecasting required. The customer has already bracketed, the return is already in motion, and the question is simply whether a small incentive costs less than the return itself. In this case, it does.
Both tactics use the same underlying principle. The cost of the return is knowable. Once you know it, you have a budget to work with.
A Fix for the Numbers
When Antonio brought return data to merchant teams, they lit up, not because they cared about reducing returns, but because the data helped them make better products. That’s the outcome of giving teams information they’d never had direct access to before.
The average Appriss customer does $4B in sales and takes on roughly $800M in returns. Tracing those returns to root causes (missing product information, policy gaps, operational inconsistencies) only produces results if the teams responsible for each of those things can see the data and act on it together.
Merchants need to know what’s driving product returns. Supply chain needs to see their error rate.
Customer care is already hearing the reasons. The problem is that none of them are typically looking at the same source.
Antonio’s 30–50% estimate is a starting point, but that doesn’t have to be a ceiling. Appriss connects return, fraud, abuse, and shrink data across departments so that each team has what it needs to stop contributing to the number and start protecting the margin behind it.
