
Why high-volume fraud alerts are wasting your investigators’ time

Triple investigator productivity by changing what criteria your alerts are based on.
Welcome to the forest of fraud (stay with us).
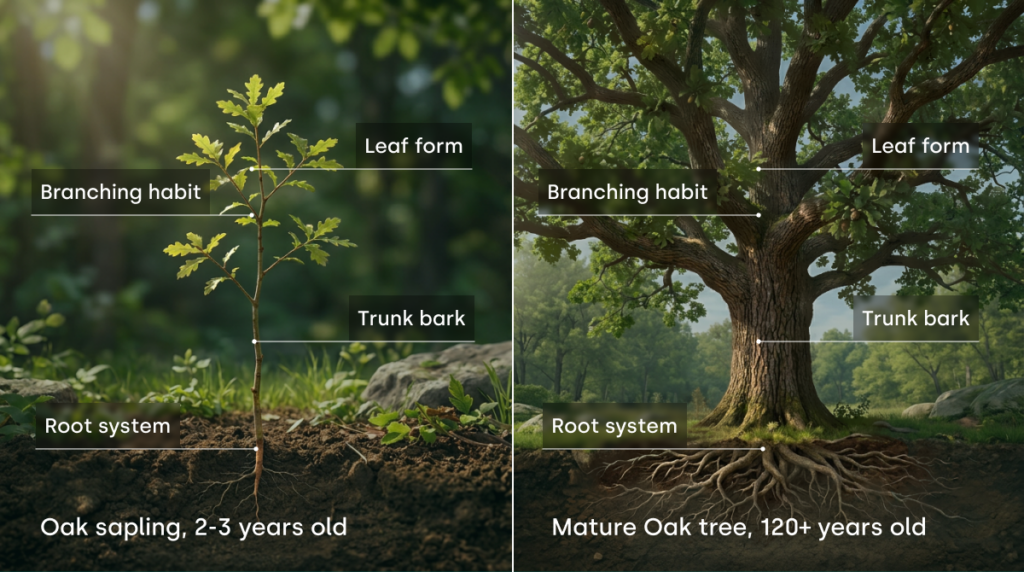
Imagine every tree that sprouts is a specific case of fraud and abuse. By the time a tree is mature, the roots have been there for years, growing since they were mere saplings. The damage those roots have done to your P&L is un-recoupable as the tree has been left to grow unattended.
Volume-based fraud alerts work to catch the big ones, calibrated to catch patterns that are already established, which means the loss has already been accumulating for a while before anything trips the alert.
A Director of Loss Prevention at a large global quickserve chain set an alert for employees exceeding a daily beverage threshold using that volume-based logic. One investigator, fifty alerts, eight hours… but zero cases? The alert was pointing at big trees, but any indications of real fraud or abuse, the saplings in this instance, had been missed entirely. A whole day of work, missed hits on the P&L, and a CFO wondering if this is the best use of company resources.
With 11,000+ North American locations and 10 investigators, that’s potential for hundreds, if not thousands of saplings to go unnoticed. With that pressure in mind, the team rebuilt their approach from the ground up using a five-step process to catch fraud patterns while they’re still small, all without needing additional time from people or swapping out the tech stack.
Key Takeaways:
- High refund volume can be one signal among many. Refunds of the same item, multiple times, on the same transaction, are a stronger one.
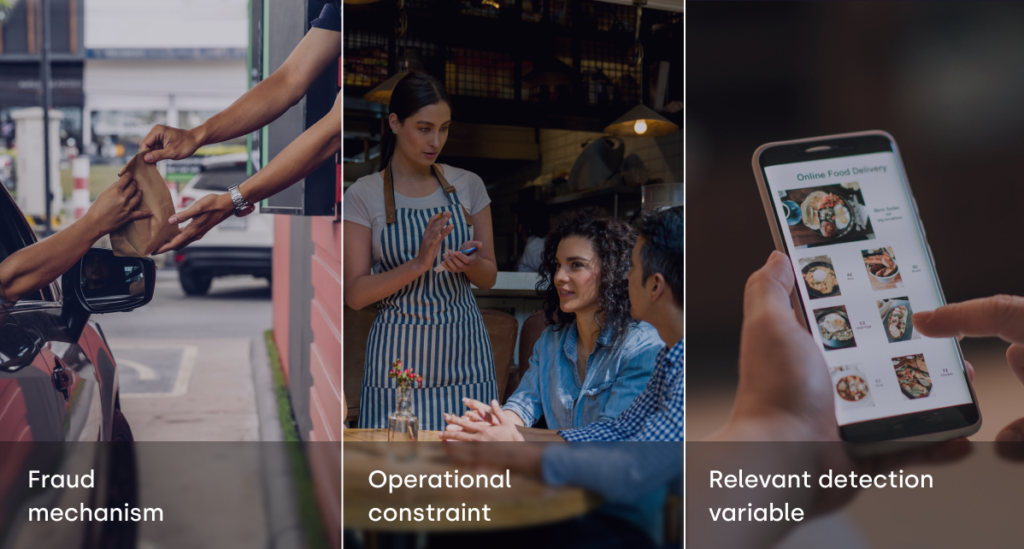
- Every operational channel — drive-through, café, mobile — has a distinct fraud and abuse risk profile that requires unique detection logic.
- Labor data, when correlated with benefit usage, turns a nearly impossible-to-threshold metric into a 100% reliable abuse flag.
Volume doesn’t tell you what you’re looking at
Standard loss prevention analytics were built to surface volume: who had the most refunds, who had the most voids. That logic fails the moment context matters (and it ALWAYS matters).
A store with high refunds might be working through an inventory outage, where product gaps push customers to buy the wrong thing and return it. A barista logging a high number of free drinks might be inputting for the entire shift’s crew. Volume without context floods investigator queues with work that isn’t fraud or abuse, and there’s no built-in way to tell the difference until someone’s already burned a day on it.
The director calls what you’re actually looking for the “fraud signature” — the behavioral pattern that distinguishes intentional manipulation from operational noise. “What we know about these big tall trees is that when they’re an actual fraud problem, they look different even when they’re tiny,” the director explains. “The rules that we write help us find those little trees down below before they get large.”
Four grilled cheese sandwiches refunded on one transaction. Ninety-nine lattes refunded to cash. Those patterns don’t occur in normal operations, but they don’t require high volume to surface. What they need is the right question asked.
Five steps to fraud signature detection
Fraud signature detection starts earlier based on how fraud and abuse actually work in each specific channel and builds outward from there. From start to finish, the whole system runs on one idea: fraud and abuse have a shape before they have a size.
1. Build channel-specific detection rules
Fraud and abuse mechanics differ by channel, which means detection logic has to as well. In a café, giving a customer something for free requires the cashier and bar employee to coordinate. In a drive-through, the product is already made when the customer pulls up; the cashier can void or cancel without anyone else knowing. An alert that’s plausible in one channel may be operationally impossible in another.
Once you know the channel, build rules around behavioral signatures rather than volume counts. Refunds of the same item multiple times on a single transaction is a case. High refund volume is a maybe. Filter by channel configuration so drive-through exceptions don’t surface as café alerts.
2. Measure rule effectiveness continuously
Building a detection rule is step one. Knowing whether it’s finding real fraud and abuse is a separate, ongoing process.
Track every work item outcome: fraud or abuse confirmed, or no action taken. Those counts produce an effectiveness rate for each active rule. “We went back and started adding up the outcomes recorded as fraud, and the ones completed as no action, and we created a calculated field and started measuring that effectiveness,” the director explains. When a rule drops below target, it gets rebuilt or retired.
3. Correlate labor data to catch off-shift abuse
Some fraud patterns don’t generate suspicious transactions. They just generate plain transactions. Employee benefit abuse on a day an employee isn’t scheduled looks identical to legitimate use unless you bring in labor data.
“We built a labor table. So if Jane doesn’t work on Tuesday, and we have that labor data to know she worked Monday and Wednesday, but she got her free beverage on Tuesday, that’s what we should be measuring,” the director explains. Once the correlation was built, the off-shift work item became 100% reliable.
4. Prioritize the investigation queue systematically
A reliable queue still needs a sequencing logic. The team works the top two cases in each active work item category before moving to the next, cycling through all 47+ categories before starting again.
The director calls this “trimming the longest hairs”: always cutting the highest-risk item in each category rather than running one category to zero while others accumulate. The rotation ensures consistent coverage across the full fraud and abuse risk spectrum, and anything with an old date in the tracker surfaces as a backlog flag before it compounds.
5. Build regional performance dashboards
Work item data, aggregated at the regional level, shows where POS risk is concentrated and whether it’s improving.
Regions with higher work item counts carry higher concentrations of flagged behavior. Regions with year-over-year reductions are demonstrating measurable improvement. “We’re actually able to heat map the business and point out what markets actually have higher point-of-sale, sales-reducing risk activity,” the director explains.
That data creates accountability conversations with regional leadership that case closure metrics alone can’t support.
Pruning before taking down a forest
When the director first joined, investigators closed 1 to 1.25 cases per week. After rebuilding around fraud and abuse signatures, continuous effectiveness measurement, and systematic queue prioritization, the team runs at 3 to 4 cases per week per investigator, with top performers reaching 5+. Last year was the highest investigation close count in company history.
The detection system holds a 72% effectiveness rate: nearly 3 in 4 flagged cases are real fraud or abuse. Some regions have seen work item counts drop significantly year-over-year.
When you catch the saplings early, fewer of them become the kind of problem that needs a crew and a wood chipper.
Frequently asked questions
How do I know if my current detection rules are finding real fraud and abuse or generating false positives?
Track outcome rates. Every time an investigator closes a work item, record whether it confirmed fraud or abuse, or resulted in no action. Once you have a baseline — even a rough one — you can calculate what percentage of your rules are producing real cases. A well-tuned detection system should confirm fraud or abuse in the large majority of flagged cases. If you’re seeing confirmation rates well below that, the rules need reworking before your investigators lose confidence in the queue. The fastest way to kill an EBR program is to publish alerts that don’t lead anywhere.
Our team is too small to investigate everything. Where should we start?
Prioritize by category rotation rather than case volume. Work the top two or three items in each detection category before going deeper on any single category. This ensures you’re covering the full spectrum of fraud and abuse risk rather than running deep on one type while others accumulate. It also makes capacity issues visible faster — if a category isn’t getting worked, you’ll see it in the tracker date fields before the backlog becomes unmanageable.
How do we build channel-specific detection rules if our analytics platform doesn’t filter by channel configuration?
This is a platform question worth taking seriously. If your detection system can’t distinguish between a drive-through void and a café void, you’re guaranteed to generate false positives — because the fraud and abuse mechanics are different in each channel, and the threshold that makes sense for one doesn’t apply to the other. When evaluating any EBR or POS analytics platform, ask whether it can filter by register configuration, channel, or operational context. That capability is what separates a detection system that finds fraud and abuse signatures from one that just surfaces high volume.
We have employee benefit programs that generate a lot of transaction noise. How do we find the real abuse?
Bring in labor data. If you can correlate benefit usage with scheduling information, you shift the question from “how much did they use?” — which is nearly impossible to threshold cleanly — to “did they use it when they were actually scheduled to work?” That second question has a clear answer. An employee who accessed their food or beverage benefit on a day they weren’t scheduled is a work item worth investigating. An employee who used their benefit six times on a day they worked a double shift probably isn’t. The signal changes completely once labor context enters the picture.