Walk the aisles of any brick-and-mortar store or scroll the pages of ecommerce platforms, and it’s clear that the very foundations of retail shopping are shifting.
Appriss Retail, armed with insights from more than 60 of the top 100 retailers, narrowed in on seven major retailers to collect returns data spanning several diverse sectors, including footwear, specialty hard goods, home improvement, and sporting goods.
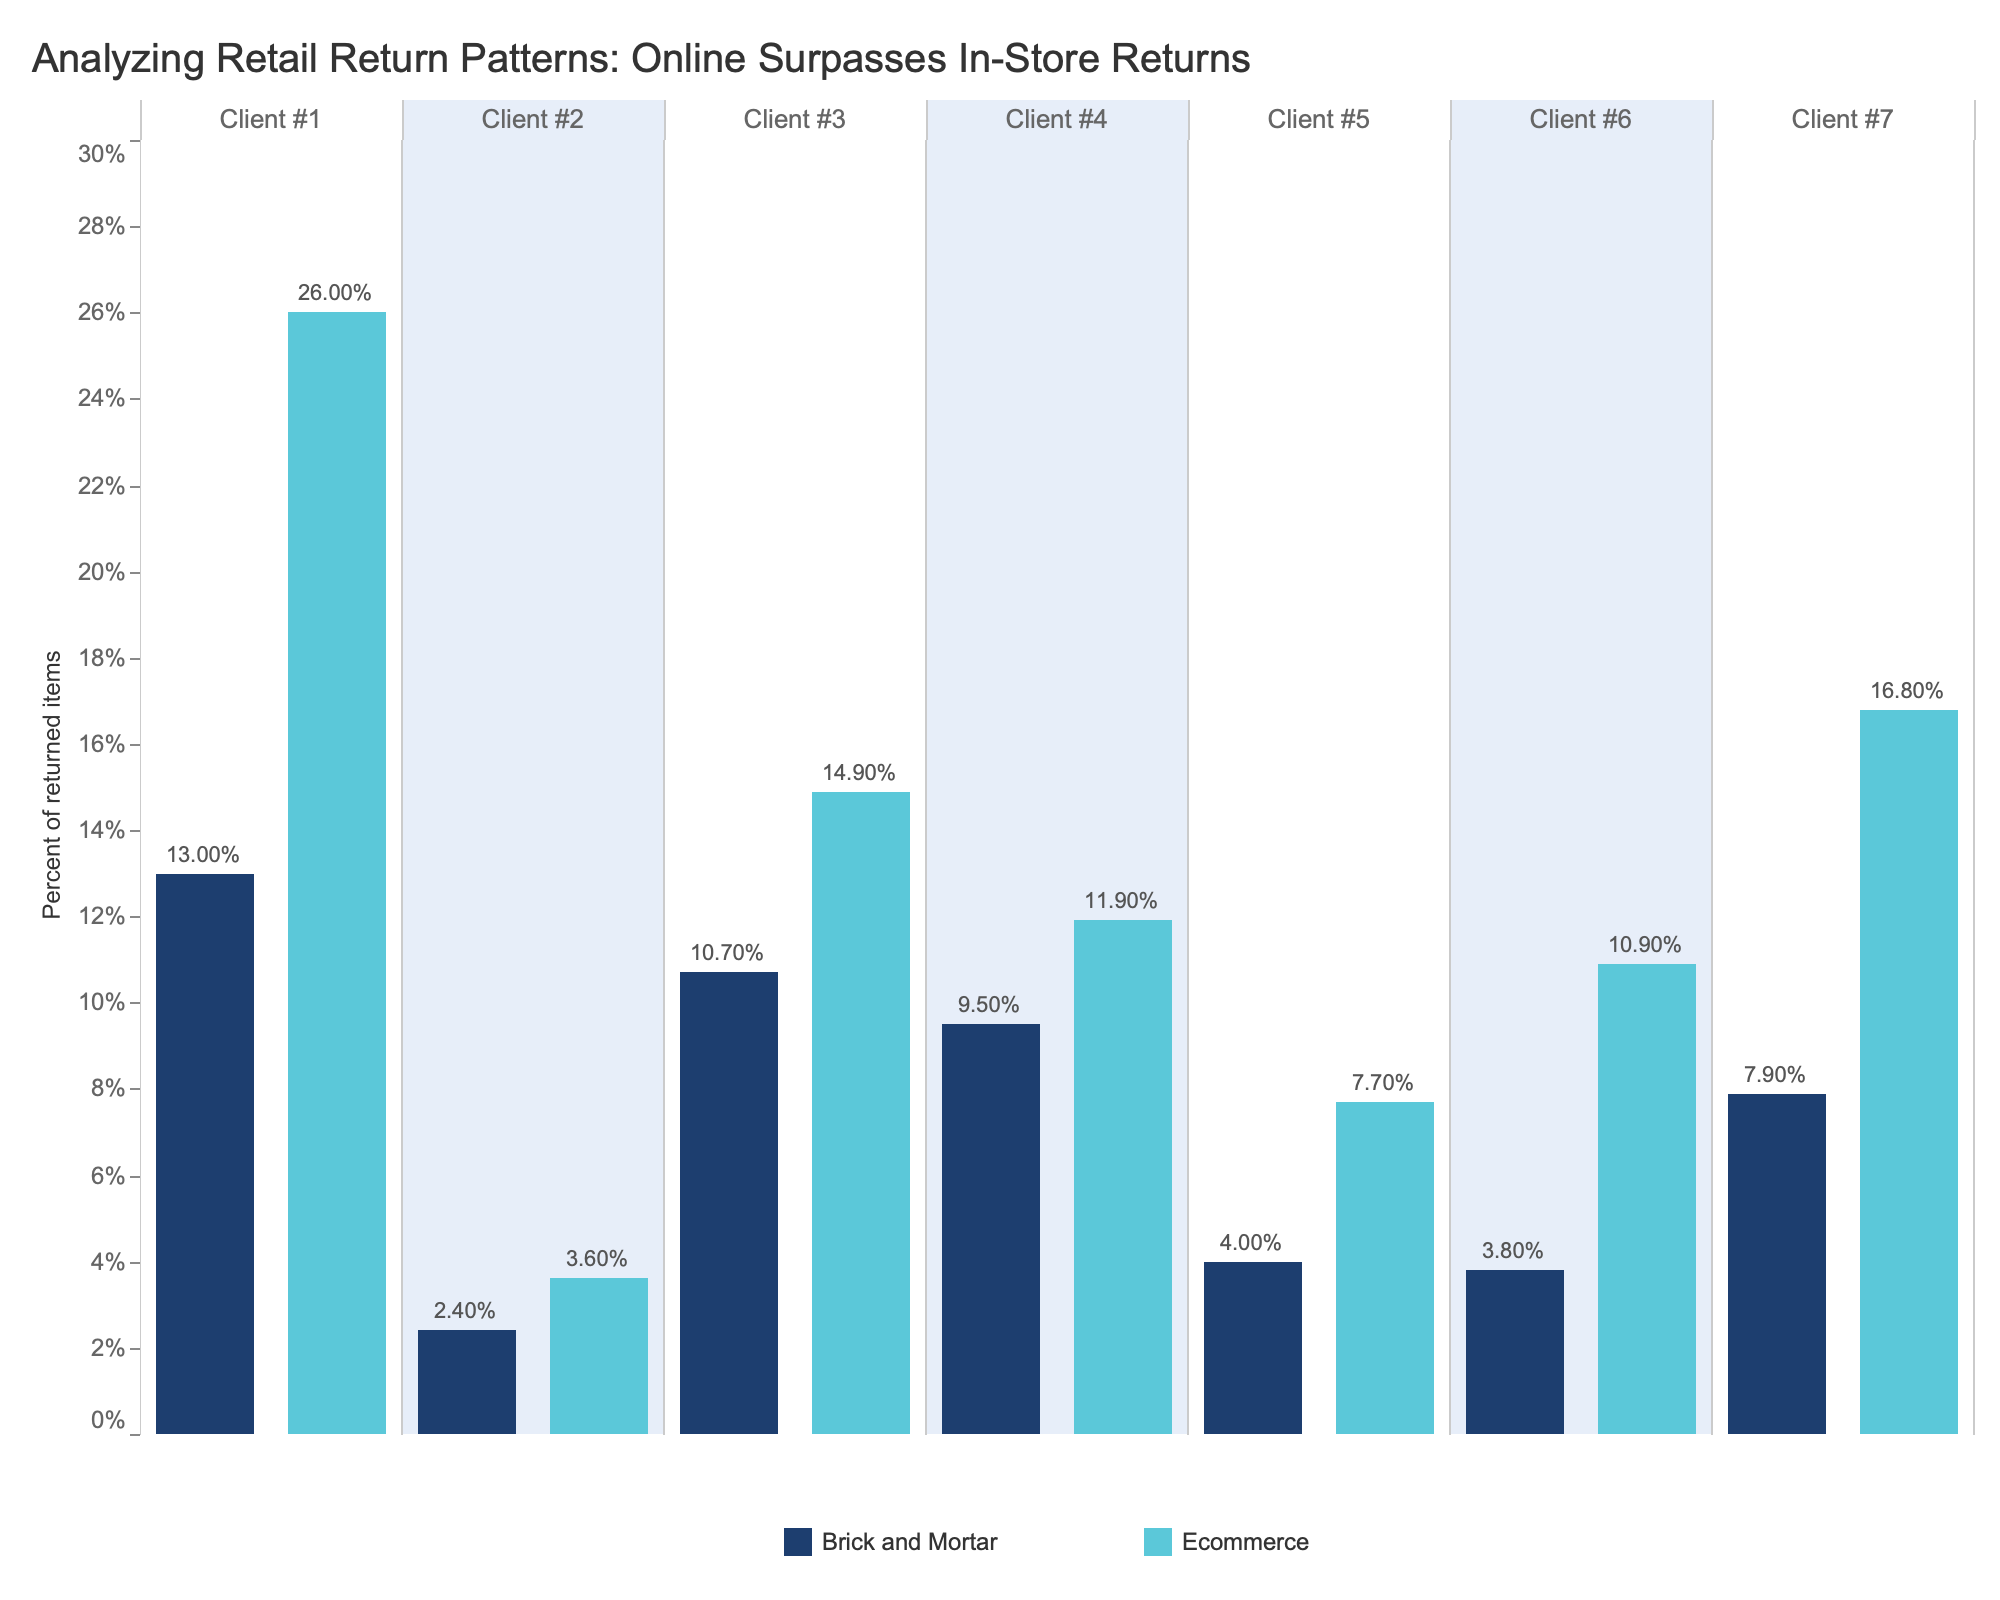
The research found — across the board — that the ecommerce return rate is nearly twice as high as the return rate of in-store purchases.
To better manage and navigate issues with returns from online purchases, retailers need to understand online shopping behaviors. This study of seven retailers dissects assumptions around online and in-store returns and overall baskets to guide retailers through the evolving ecommerce landscape.
Weighing the impact of growing ecommerce sales and retail fraud
The analysis of the seven retailers compares each retailer’s brick-and-mortar (B&M) and ecommerce sales and returns side by side and aims to better understand retail return rates in an era when ecommerce is growing significantly. In fact, Forrester predicts by 2027 total ecommerce retail sales will hit $1.6 trillion in the U.S.
Case in point, as total retail revenue soared to an estimated $5.1 trillion in 2023, online sales were a key driver. The 2023 Consumer Returns in the Retail Industry Report finds that online sales increased by 10% in 2023, achieving a total of $1.4 trillion in online sales. At the same time, online returns increased from 16.5% to 17.6% of total online sales, a total of $246 billion.
More online spending will lead to more online returns as customers can’t see or try on a physical representation of each product. Fraud is also a growing issue alongside rising ecommerce sales and returns. In fact, more than half of the respondents in the 2023 Retail Security Survey said they have seen an increase in ecommerce fraud this year.
Reviewing where retail returns are more frequent when buying online
In the study, Appriss Retail compared each retailer’s B&M and ecommerce activity side by side. The research utilized the following formulas:
Brick and Mortar Return Rate Equation
(Returns In-Store) ÷ (Sales In-Store – BORIS Returns)
(Returns In-Store – BORIS returns) ÷ (Sales In-Store)
Ecommerce Return Rate Equation
(Returns Online + BORIS Returns) ÷ (Sales Online)
The study reviewed sales and returns at seven different retailers, denoted as:
- Client #1 (Footwear Retailer)
- Client #2 (Specialty Hard Goods Retailer)
- Client #3 (Home Improvement Retailer)
- Client #4 (Second Home Improvement Retailer)
- Client #5 (General Merchandise Retailer)
- Client #6 (Second General Merchandise Retailer)
- Client #7 (Sporting Goods Retailer)
As seen in the graphic below, across each type of retailer, the online return rate is much greater than the in-store return rate, ranging from a 30% difference for the least impacted retailer (Client #4) to nearly three times higher for the most affected retailer (Client #6).
Client #1, the footwear retailer, demonstrates the highest online return rate among all the retailers studied. The category is prone to returns from consumers sending back items after they try them on at home. However, each retailer saw a larger rate of returns from online sales, making them more susceptible to a rise in online return fraud.
Retailers must be aware of common return fraud cases, such as gift card fraud. Return authorization solutions can help retailers identify potential fraud cases in real time using predictive analytics and statistical models.
Comparing in-store and online retail sales
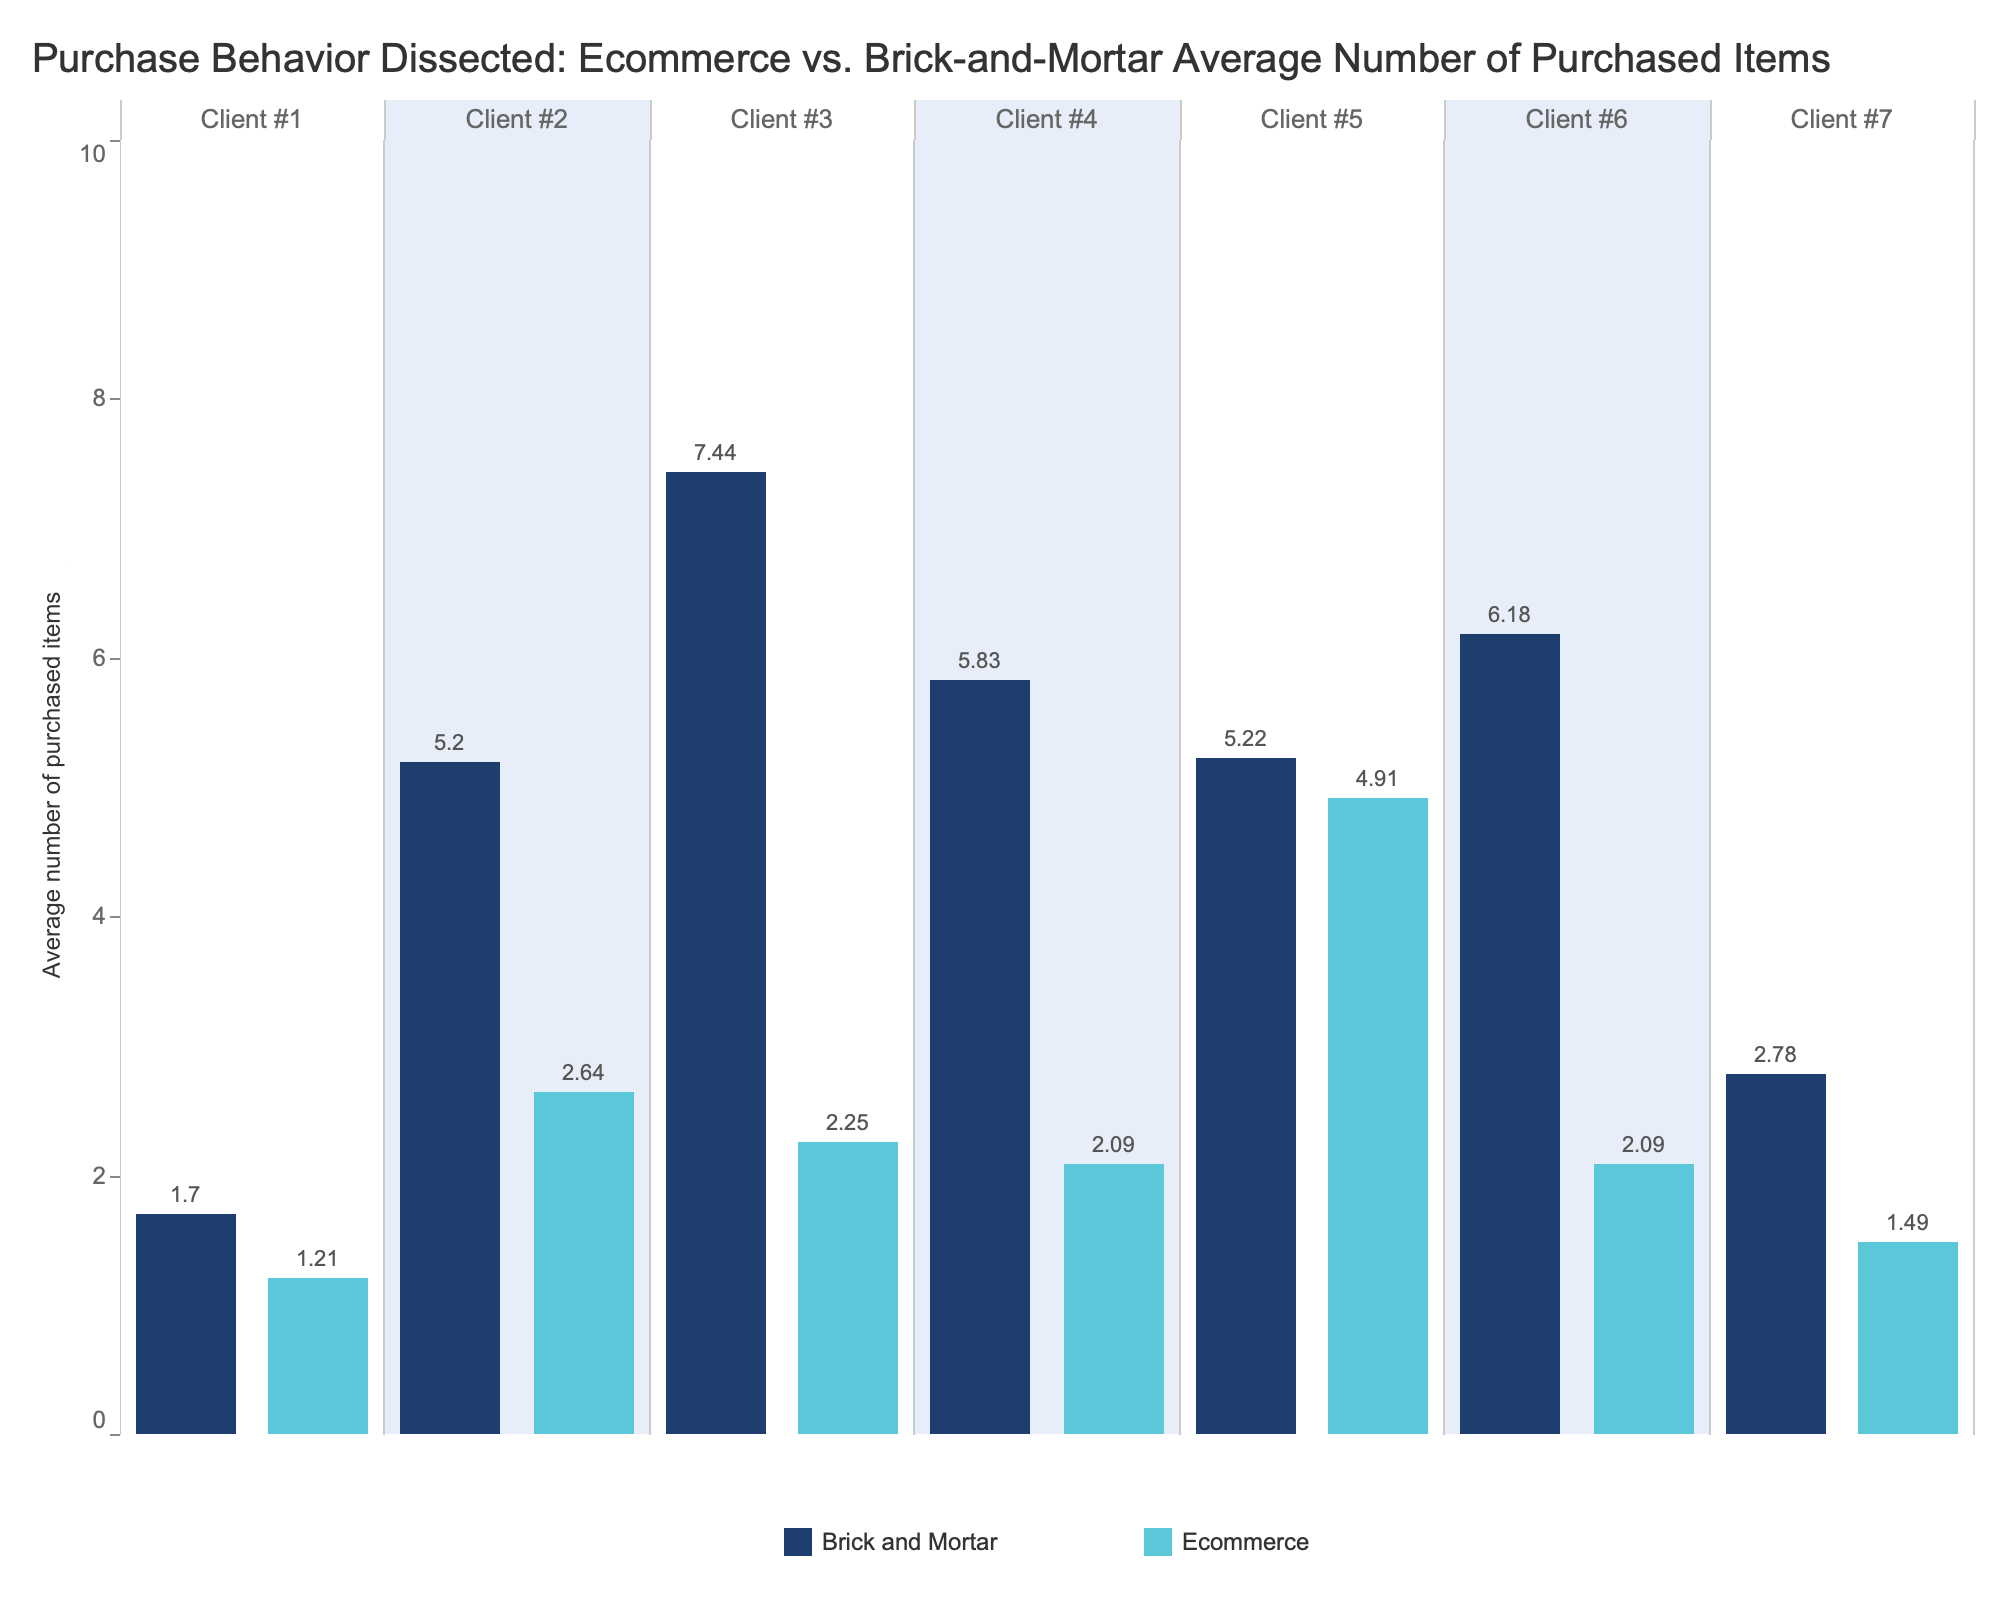
Retailers can also learn more about return behavior by taking a closer look at the in-store and online sales. Contrary to assumptions, the research finds that, on average, the number of items purchased online is fewer compared to in-store. The insight holds across the retailers (see the chart below).
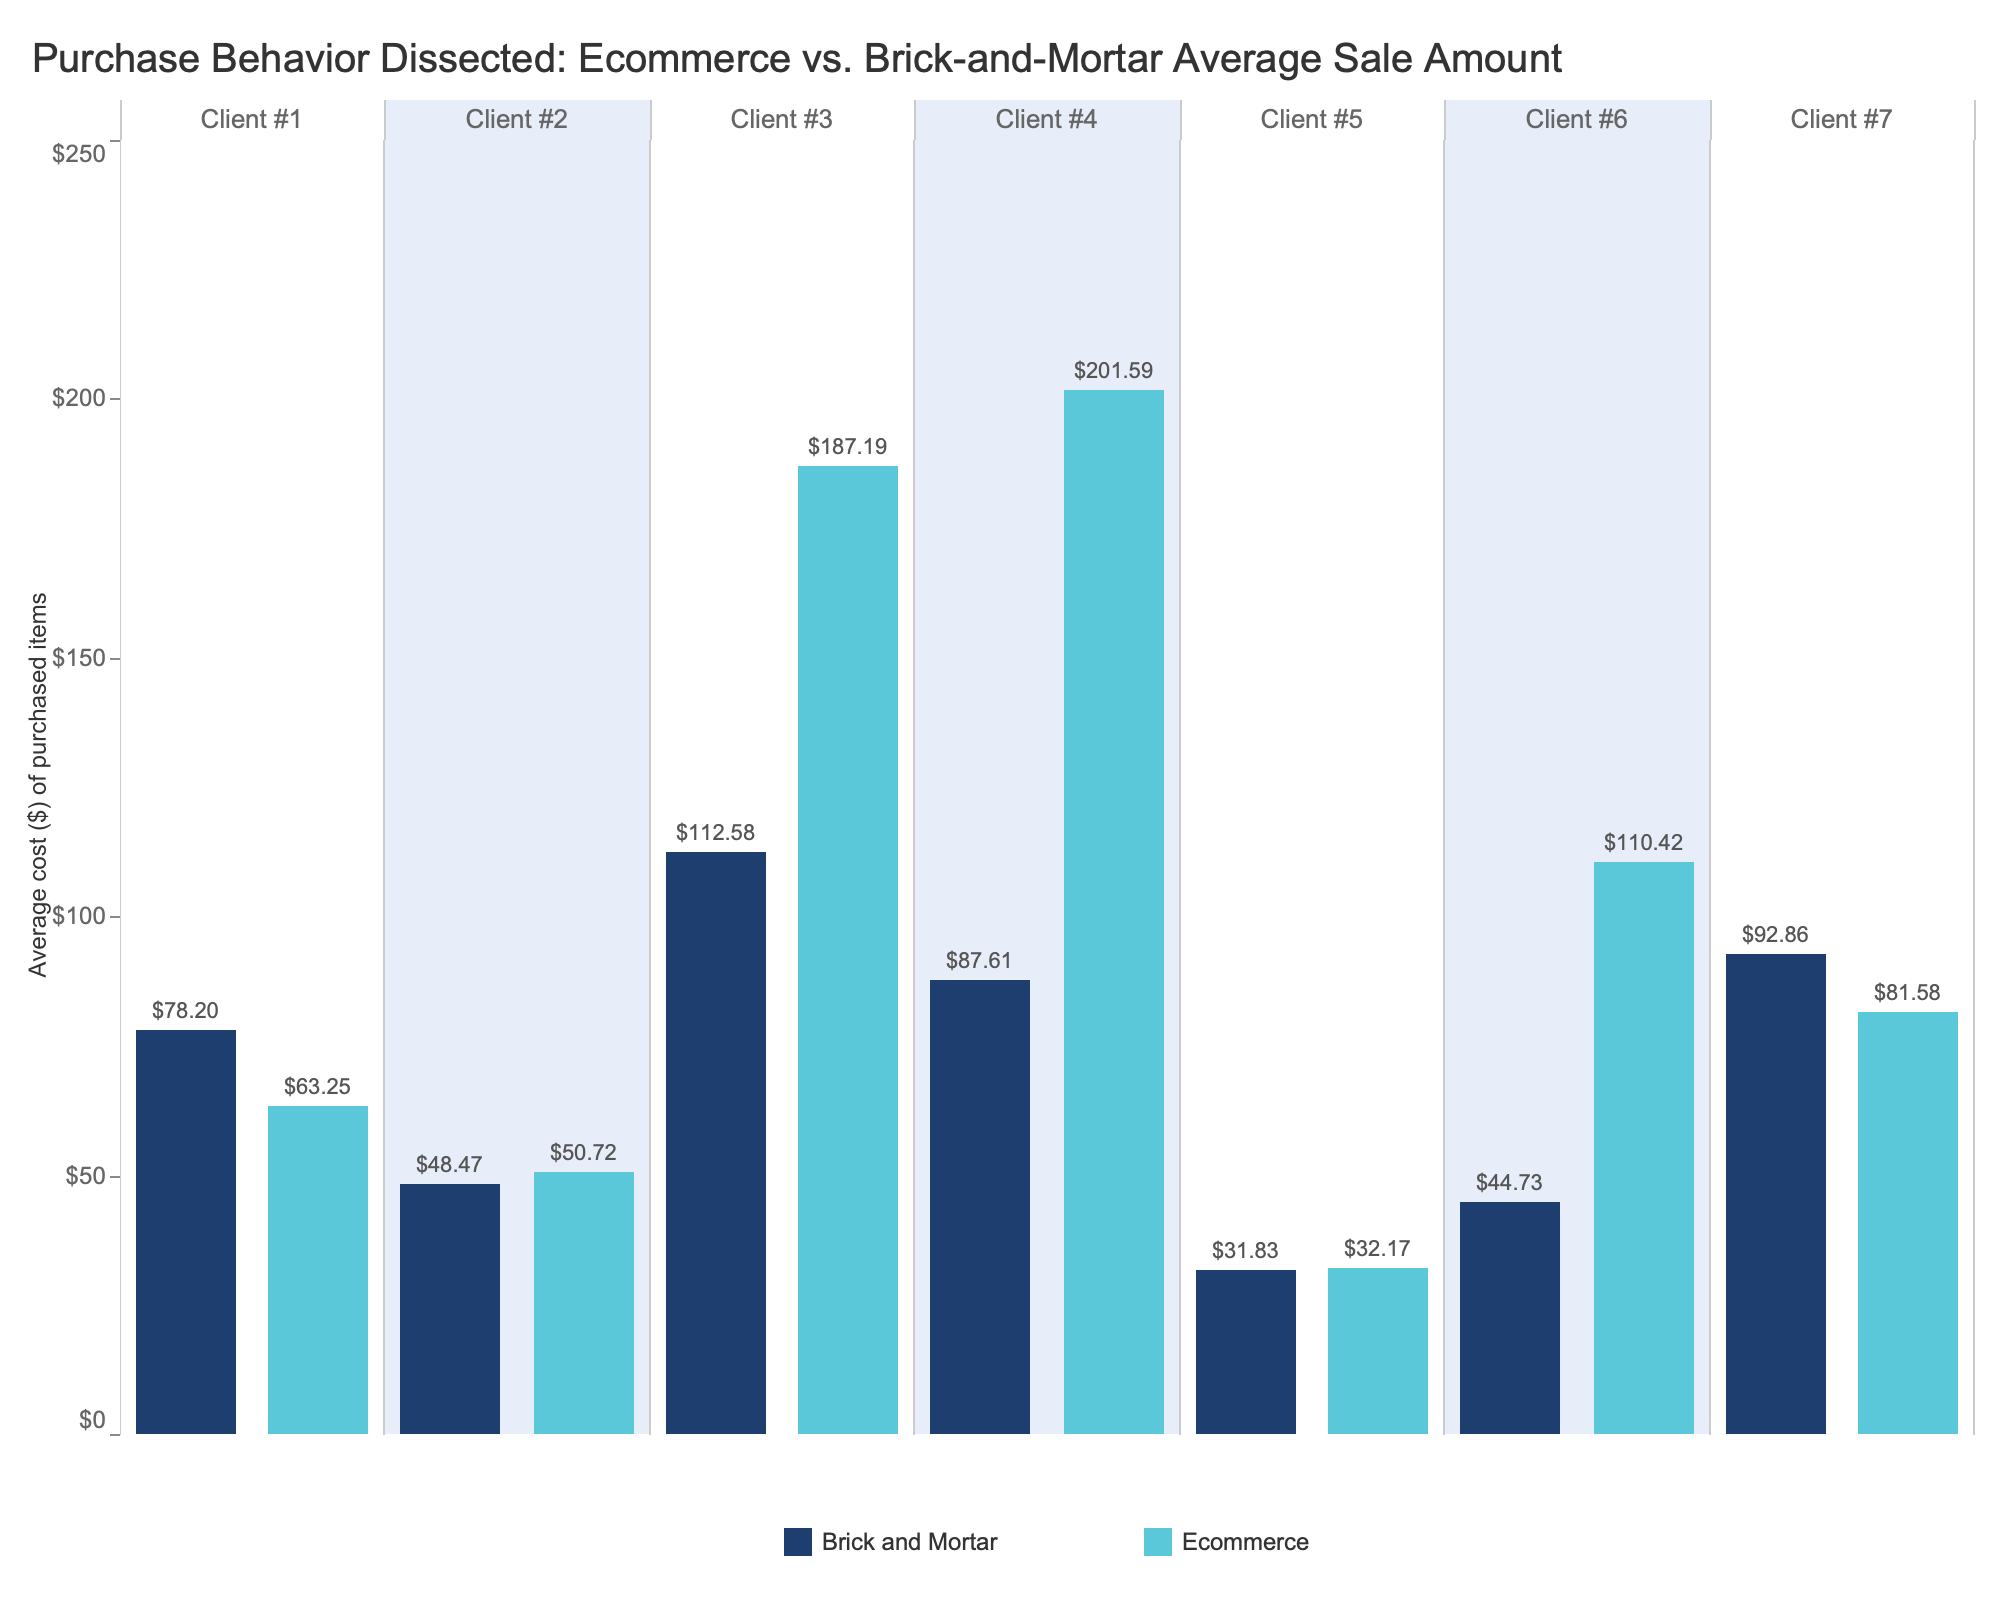
However, when looking at the overall dollar value of the sales, the results varied by retailer. For example, retailers in footwear and sporting goods (Client #1 and Client #7 below) show slightly smaller sales values online than inside a store.
Contrary to assumptions, the research finds that, on average, the number of items purchased online is fewer compared to in-store.
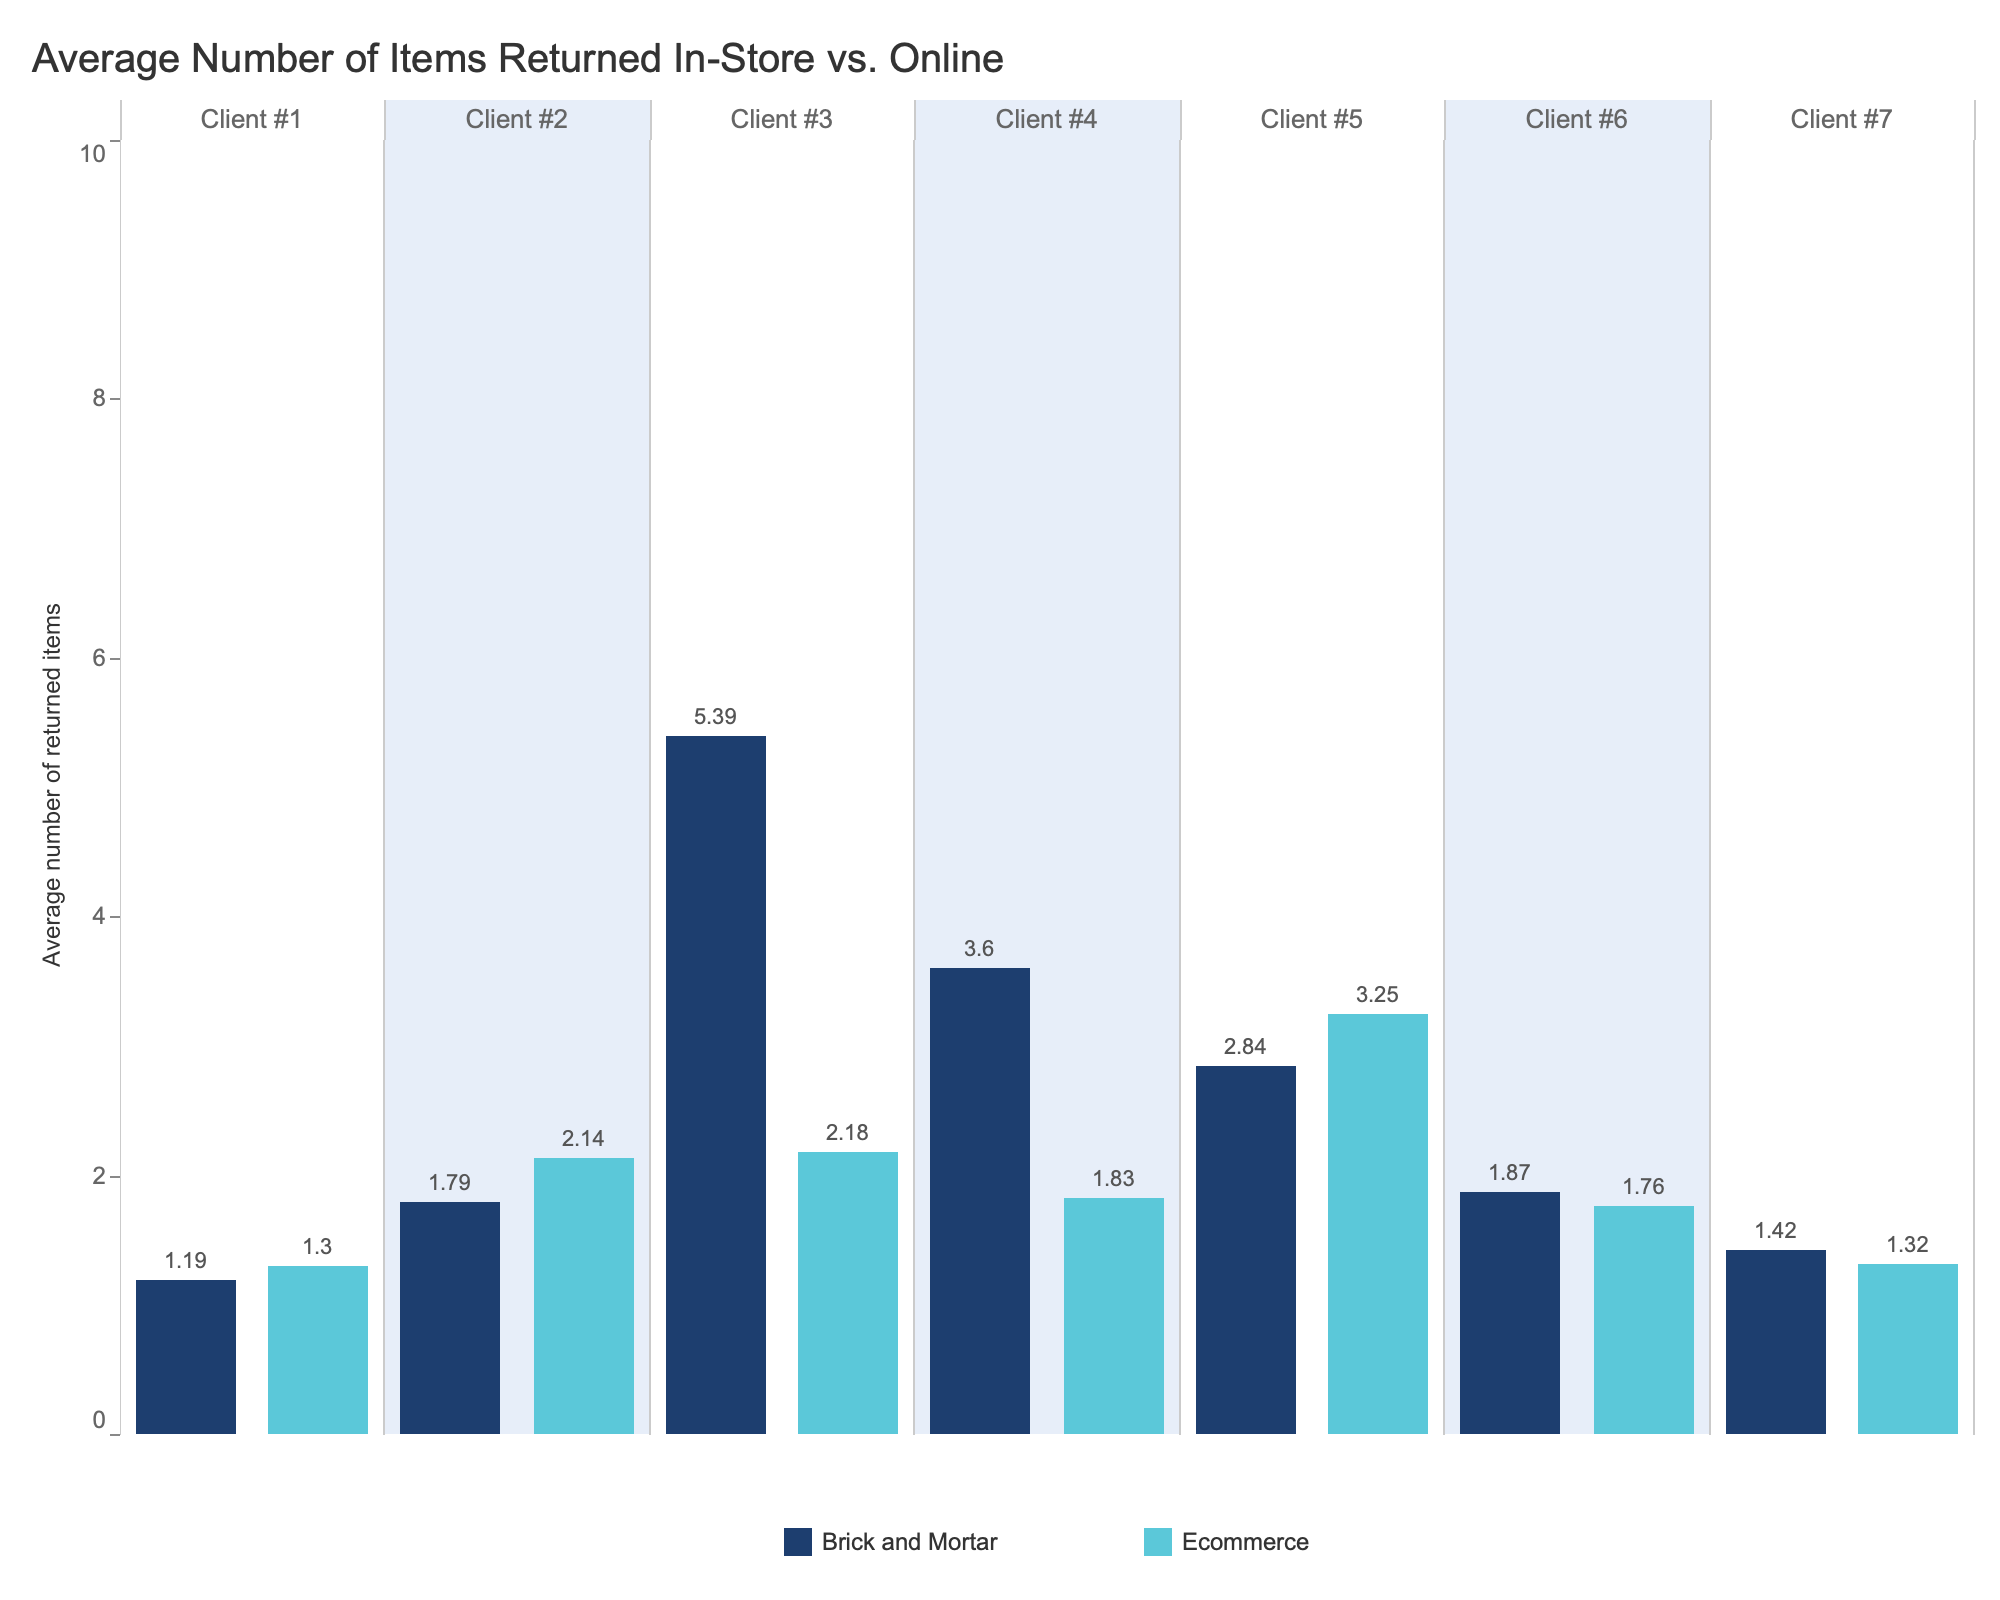
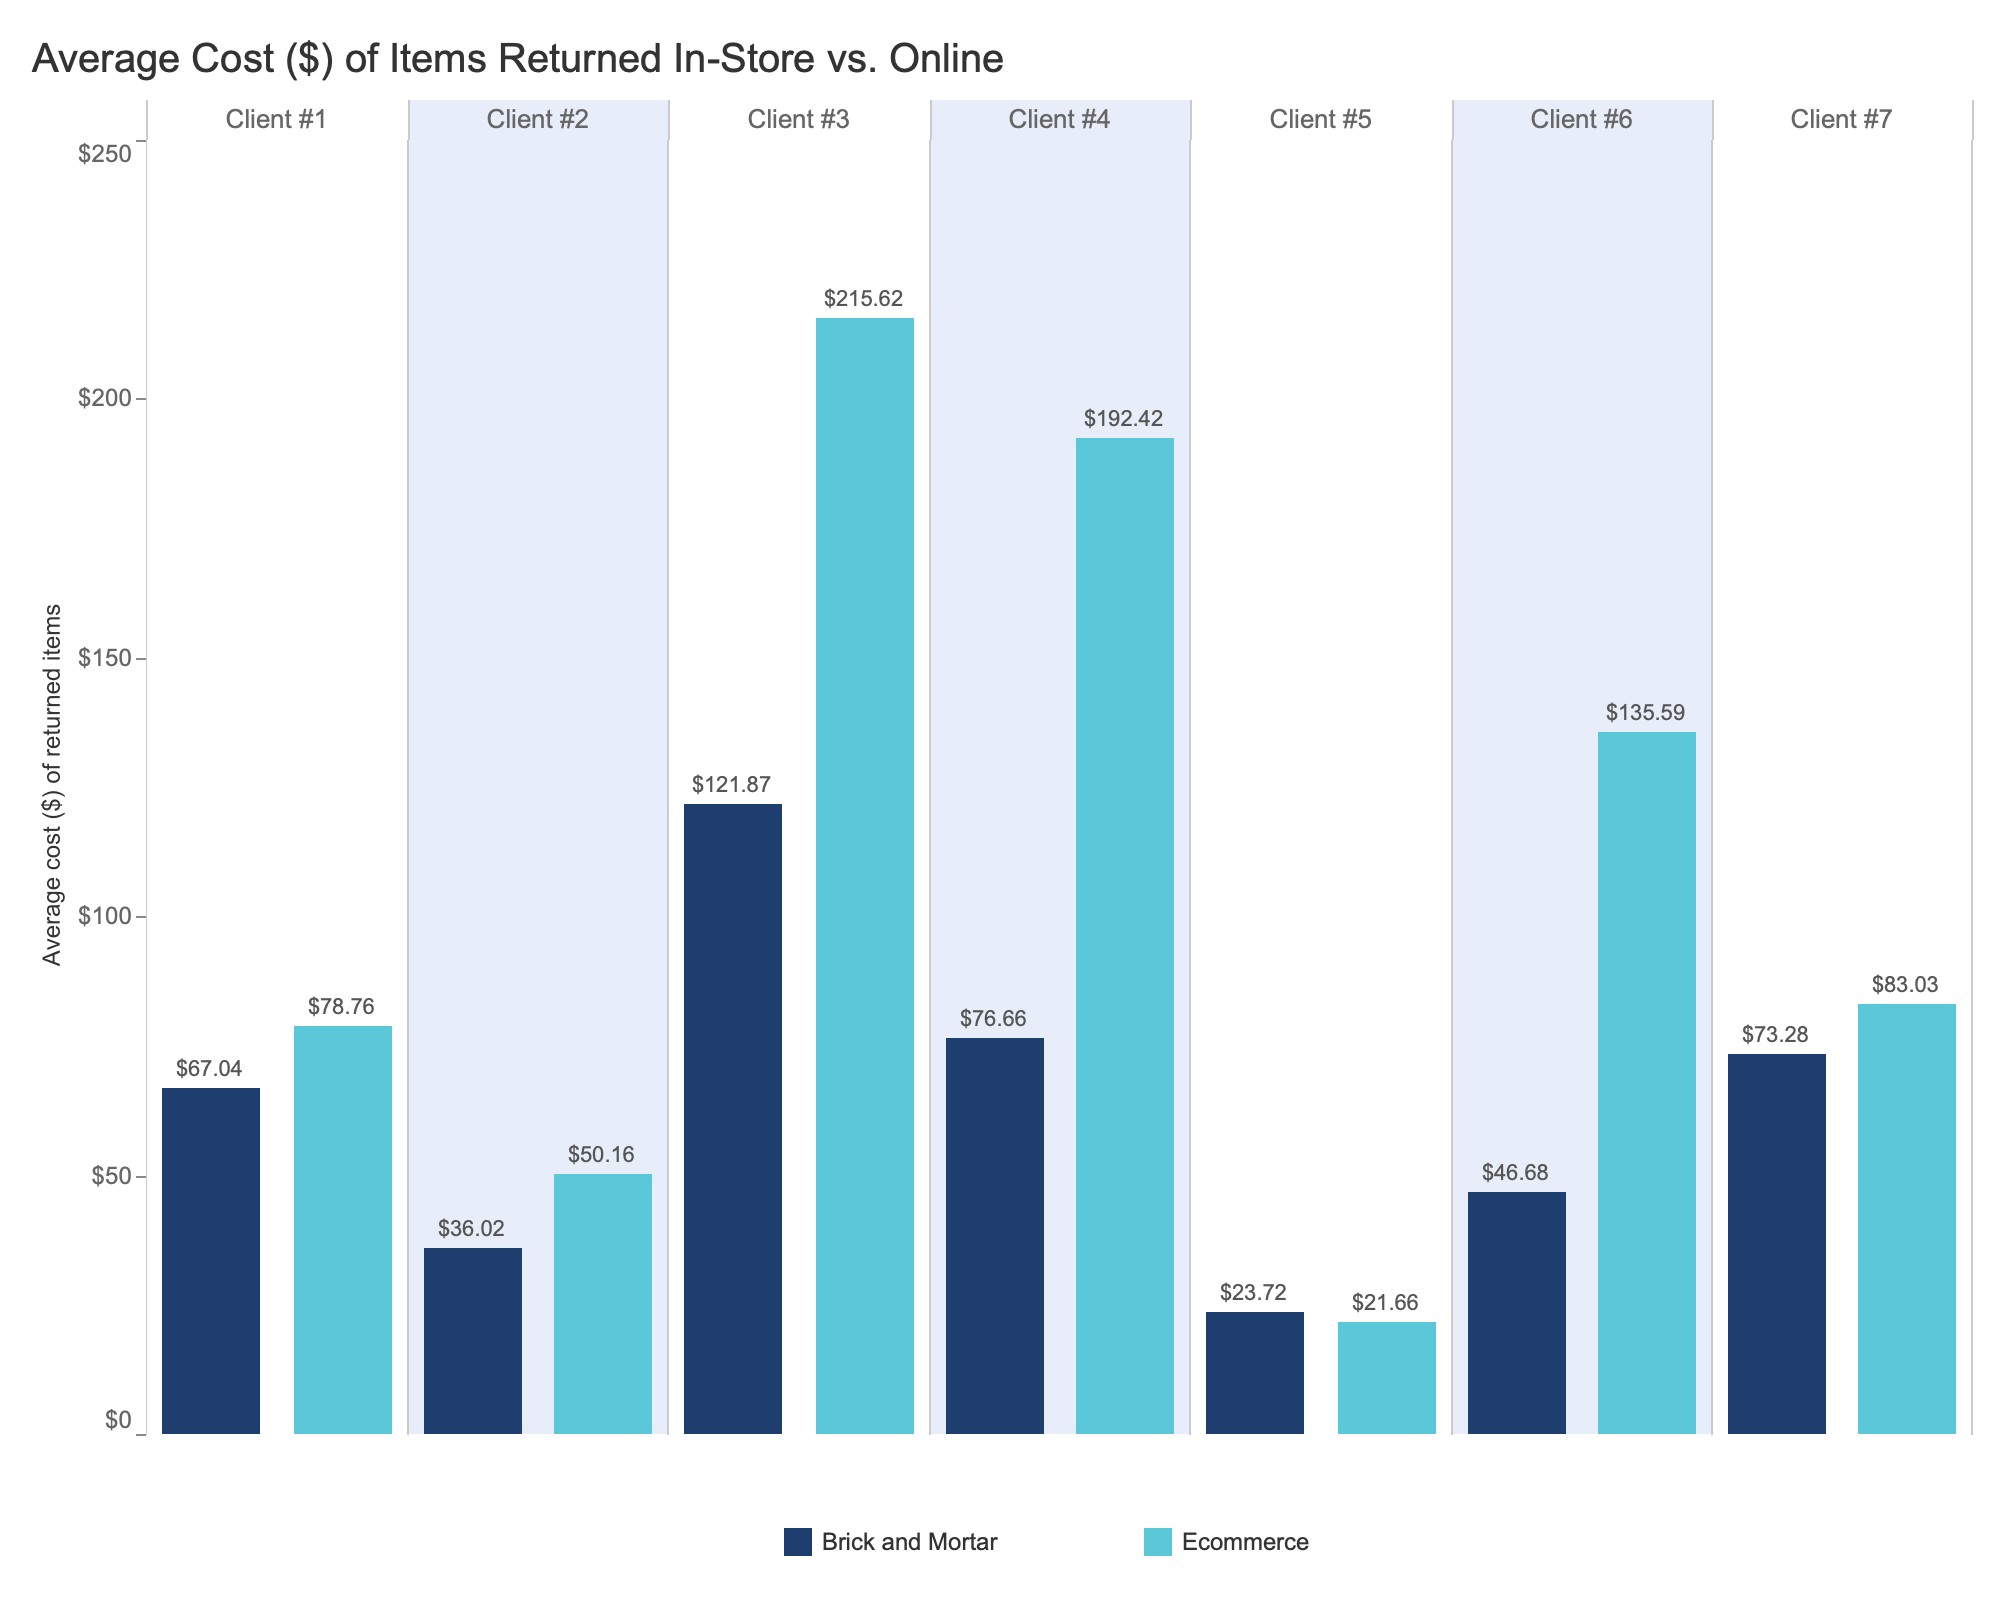
Similarly, the study looks at the number of items and the dollar value of items identified in the return. The analysis reveals that within four retailers, the average number of returned items is fewer online, while for three others, it’s higher, depending on the nature of the products (hard goods vs. general merchandise vs. soft goods). The same pattern occurs when looking at the value of the returns.
 |
 |
Understanding the impact of retail return rates
As retailers continue to expand their presence online, they will need to brace for higher volumes of returns and implement strategies to counter fraud and abuse online and in-store. To do this, retailers need to understand consumer behaviors when shopping in both channels, which includes analyzing online shopping and returns baskets.
Retailers can further safeguard their financial interests by accurately identifying and addressing return fraud and abuse through deep and personalized customer analysis. To keep an eye on return fraud, read How to Prevent Return Fraud: 8 Common Types.


